It was a generally positive week on the equity markets with modest gains in most developed markets. The bond market was essentially flat while oil is moving up due to ongoing shipping issues in the Red Sea. We are into another round of earnings so many investors are keeping their powder dry until they have the latest results.
| Index | Close Jan. 19th 2024 | Close Jan. 25th 2024 |
| S&P500 | 4,840 | 4,890 |
| TSX60 | 20,907 | 21,070 |
| Canada 10 yr. Bond Yield | 3.49% | 3.48% |
| US 10 yr. Treasury Yield | 4.15% | 4.12% |
| USD/CAD | $1.34290 | $1.34784 |
| Brent Crude | $78.56 | $82.08 |
| Gold | $2,029 | $2,020 |
| Bitcoin | $41,605 | $39,894 |
Source: Trading Economics & S&P Cap IQ
At their first meeting for 2024, the Bank of Canada opted to hold interest steady. In their post meeting release, they pointed to easing inflationary pressures globally while balancing that against above target core inflation. Growth for 2024 is not expected to kick-in until the latter half of the year with Canada’s GDP growth expected be an anemic 0.8% in 2024 and 2.4% in 2025. The Bank continues to reduce its balance sheet (quantitative tightening or QT).
The European Central Bank (ECB) had pretty much the same message. Rates are on hold, and they will continue reducing their bond holdings. ECB President Christine Lagarde poured a bit of cold water on expectations of a rate cut in April, saying the Bank considers it too early to be talking about easing.
There doesn’t seem to be any holding back of the US economy, which will confuse matters for the Federal Reserve. Q4 US GDP came in at an annualized 3.3% driven by consumer spending. Inflation also eased while the labour market remained strong. For those of you following US politics (it is hard to look away), a strengthening economy and declining inflation will boost the chances of the incumbent, Joe Biden.
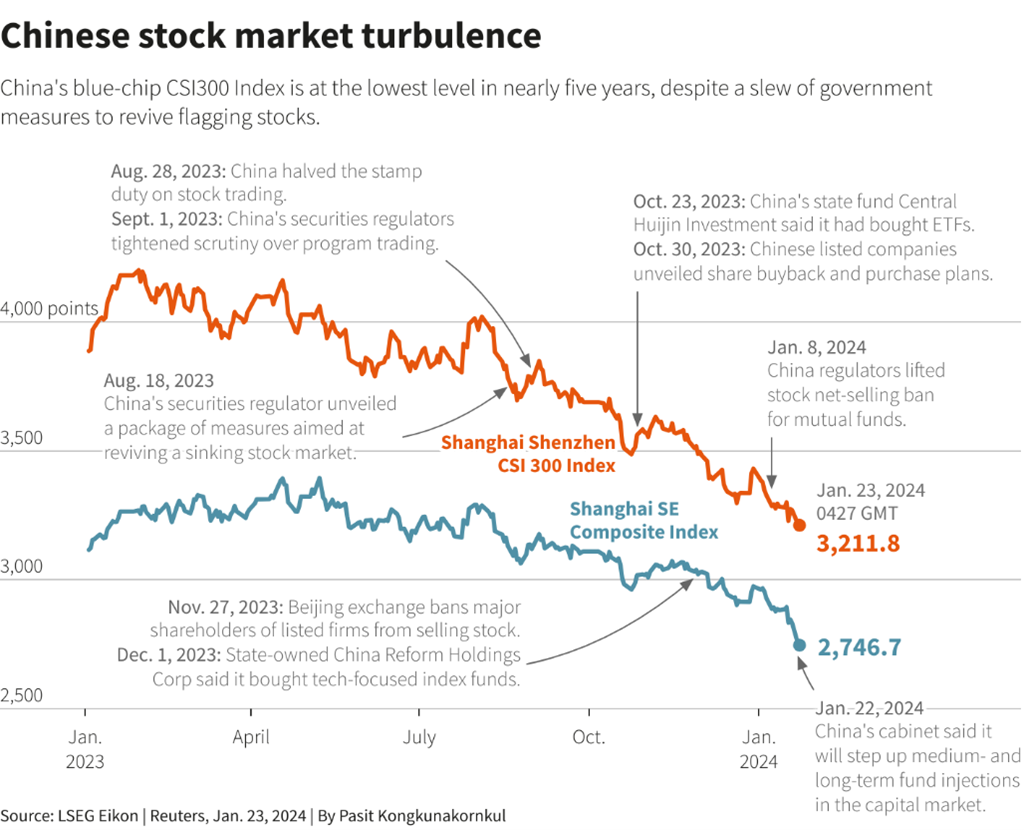
Things aren’t quite so sanguine in China. We’ve written a lot about the travails of the economy there, so we’ll just point to the chart below, (courtesy of Reuters) that shows a market in freefall. The central government is said to be considering a $278 billion package to support the market. This will not end well.

Last week we looked at the level of the S&P500 to US GDP, which at a quick glance makes the S&P500 seem wildly overvalued. I made the argument that the index might be better benchmarked against global GDP as so many of the companies operate globally. None more so than the tech sector which, in this cap-weighted index represents 28.9% of the total, followed by Financials (13%) and Health Care (12.6%). The following chart compares the S&P 500 (blue) to S&P500 Equal Weight (amber) (all components are equally represented) where Industrials account for 15.6% of the index and Information Technology ranks 4th at 13%. The laggard is the Russell 2000 index which is the US small and mid-cap benchmark.

Chart Courtesy S&P Capital IQ
There are a few takeaways here. First, the stock market is not the economy. Secondly, when comparing an index to anything, know how the index is constructed to make sure it is a relevant benchmark. Finally, cap-weighted indices can become skewed when on company or sector starts to dominate. The best example I have is the Canadian index where Nortel represented 33.47% of the TSX300 (as it was then) and 43.87% of the TSX60 in early August 2000.
The longest skating rink in the world, AKA the Rideau Canal in Ottawa, re-opened this week for the first time in 2 years. It may not be open for long as temperatures have climbed again. Don’t let that stop you from enjoying this skater’s classic – have a great weekend.
Russ Lazaruk, RIAC, CIWM, CIM, FCSI
Managing Director & Portfolio Manager
Tel 250.999.3329.
![]()
www.ncpdfo.com
