For the past 40 years investors have enjoyed one of the most benign and rewarding environments in history. Falling inflation and yields have boosted the prices of both financial and hard assets. Despite setbacks such as Black Monday (1987), the Asian Currency Crisis (1997), the Dotcom bust (2000-1) and Global Financial Crisis (2008-9) a conservative balanced portfolio holding 60% equities and 40% bonds has delivered a comfortable real (after inflation) rate of return over 4 decades.
The secular decline in inflation and interest rates that started in 1980 means that few people now working in the investment industry have ever experienced sustained inflation or a decade of negative real returns. For an entire generation the mantra of BUY THE DIP has been a winning strategy. It didn’t matter if it was stocks or bonds, inflation was declining, dragging interest rates and the discount rate used to value, well just about everything, down with it. What’s more, investors knew that the central banks of the world had their backs. Even if Alan Greenspan did take the punch bowl away, a new one would be served up in the morning.
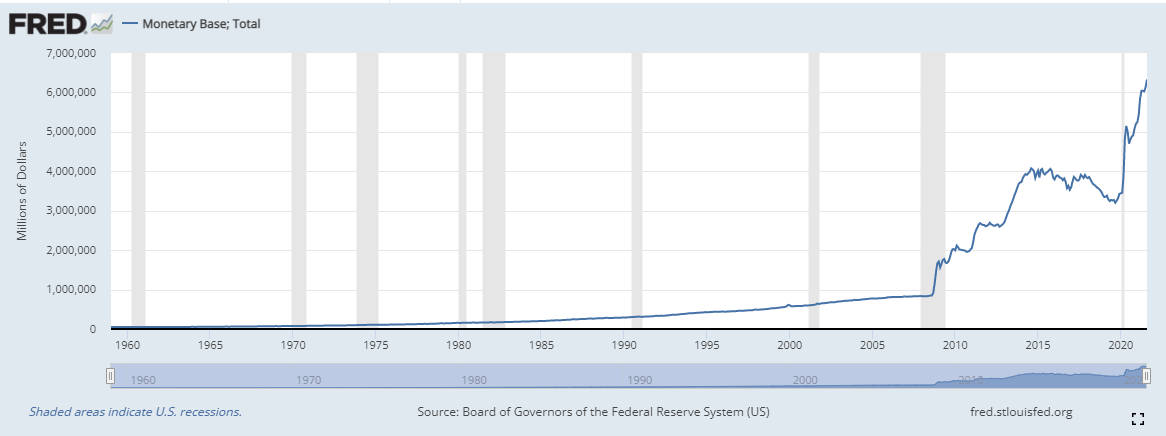
But what if the game has changed? What if the inflation we are experiencing now is not transitory but imbedded? Are investors prepared for a decade of capital and purchasing power erosion? If Milton Friedman was correct and inflation is truly just a monetary phenomenon, the amount of monetary and fiscal stimulus we are witnessing today should give everyone reason to pause. This paper is not a call on inflation as there are other forces at play that may counter Friedman’s treatise. At NCP we don’t pretend to be forecasters. We can say with certainty though, that it is mathematically impossible for the monetary conditions experienced over the past 40 years to repeat from where we are today at the zero bound
Modern Portfolio Theory
When I was a much younger and impressionable advisor the investment industry had just started its transition from being a pure salesforce to one that strived to provide a more comprehensive suite of client-centric financial services. This journey is far from complete. At the time, my firm was rolling out one of the first “wrap” programs in Canada. (A Wrap Program” is a multi-asset, multi-manager fee-based investment program) It was based on Modern Portfolio Theory (MPT) first developed by Harry Markowitz in his seminal paper “Portfolio Selection” in 1952. While Markowitz’s work had been readily adopted by institutions, it was new ground for retail investors.
Portfolios were diversified by asset class using variance and correlations to plot the optimum risk/reward trade-off on the “efficient frontier”. The diversification inherent in this approach reduces idiosyncratic or non-systemic risk however it does not protect against systemic risk. In a crisis all correlations tend to go to 1. MPT is also reliant on historical information which may be irrelevant in a scenario of fundamental change.
By its very nature, MPT ignores externalities and is focused on the pure mathematical models built around the public markets. It can not account for a change in real-world conditions such as climate change or inflation expectations. The shifts in the efficient frontier will always lag real-time changes.
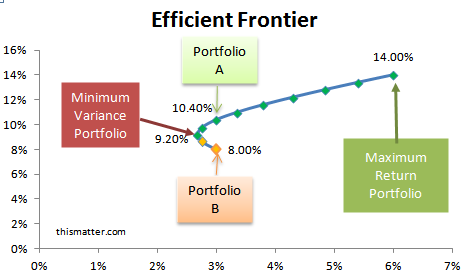
The Efficient Frontier, courtesy thismatter.com
The 60/40 Portfolio
The 60/40 portfolio has been the industry standard for almost as long as I have been working as an advisor and portfolio manager. This 60% equity 40% bond portfolio is a direct result of Markowitz’s work and for my career has generally delivered moderate volatility and attractive real returns. But the main reason for its success has been the secular decline in interest rates starting in 1980.
The 1970’s saw run away inflation that was finally brought to earth by Paul Volker’s aggressive interest rate policy at the US Federal Reserve. The 10 yr. treasury yield peaked in March of 1980 at 14.76% and followed inflation lower for the next 40 years. This provided wind in the sails of the 60/40 portfolio as falling yields drove up the value of the bonds comprising 40% of the portfolio. At the same time, still high coupon rates (by today’s standards) provided steady cashflow for re-investment.
This same dynamic allowed equity markets to benefit from a falling discount rate. This is the interest rate used to value future cashflows or earnings. The lower the rate, the more valuable a payment in the future is today. In finance terms, it caused an expansion in multiples. Those multiples, such as Price Earnings (P/E) and Return on Equity (ROE) are key indicators of fundamental value and very sensitive to the discount rate. Falling interest rates also provided cheaper financing for companies to expand. While not a perfect storm, conditions were set for the success of the 60/40 model.
The following chart illustrates the change in real returns by decade. The only outlier is 2000-2010 where there is an end date bias thanks to the Global Financial Crisis of 2007-9. The balanced portfolio is 60% S&P500 and 40% constant maturity 10 yr. US Treasury Notes. Returns are in USD.
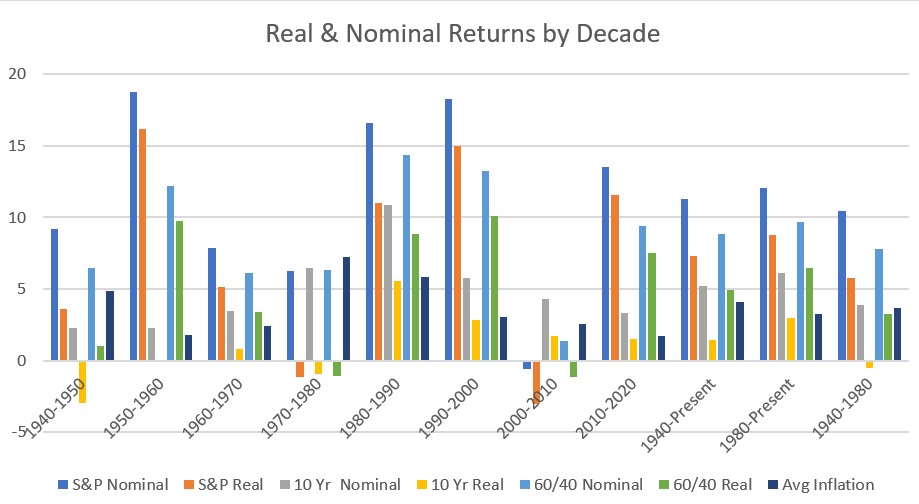
Chart: NCP Capital Partners. Data Source DQYDJ.com
Putting It All Together
If higher inflation is here to stay (and that is not a given) those tailwinds we have enjoyed for the past 40 years have shifted and will be a drag on performance. The case for higher inflation revolves around monetary policy and central banks not being able to put the genie back in the bottle. With markets seemingly addicted to more quantitative easing (QE), US private debt at 235% of GDP, wages going up as businesses try to entice more workers back, and US Federal Government debt at 125% of GDP the prospect of higher rates can have a chilling effect.
The counter argument to embedded inflation is that the rise in prices we have seen are caused more by what is happening in the real economy than monetary policy. Supply chain issues have created real shortages and higher prices, but these bottlenecks will open up over time. Wage growth will slow again with more automation. Inflation had turned negative at the start of the pandemic, creating a lower base from which current prices are compared. Forward comps should be lower. Commodity prices, which spiked earlier this year have come back to earth, energy being the current exception.
At the beginning of this article, I said we are not forecasters. We don’t know which scenario will unfold so must be prepared for either outcome. We are risk managers though and stewards of our client’s capital. Our job now is to put in place those assets and/or strategies that can protect our clients from the erosion of the real value of their capital and purchasing power, no matter what the future brings.
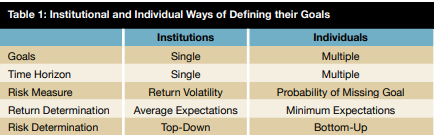
This takes us away from MPT and the 60/40 portfolio to Goals Based Asset Allocation (GBAA). This method of allocating investment capital focuses on the probability of achieving your goals rather than the volatility of an overall portfolio. It is tailored to the needs of each family and their discrete goals. In many ways it is like the liability / asset matching of insurance companies or the liability driven investment strategy of pension funds.
But institutions generally have only one goal to manage. Families (or individuals) will have multiple goals, each with different levels of importance. The differences are critical to the success in realizing the family’s objectives.
In practical terms, this is a process that looks simple but takes time, expertise, and consultation to do well.
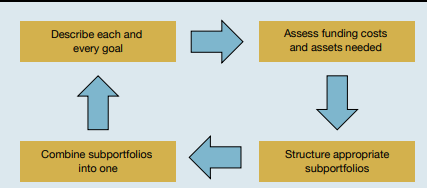
Like Mazlow’s Hierarchy of Needs, GBAA incorporates a hierarchy of goals from the most basic lifestyle and income needs to philanthropic and aspirational goals. Each goal has its own sub-portfolio which is assigned a desired probability of success in real and nominal terms. Success is then measured against the probability weighted goals.
The ultimate result is a portfolio that is truly aligned with each individual family and able to deliver against their goals rather than be held hostage to artificial benchmarks.
Russ Lazaruk
Managing Director Wealth Management & Portfolio Manager