Because SDA+ is a target return methodology designed to thrive in diverse economic conditions, readers may reasonably question the necessity of developing macroeconomic and financial market forecasts.
We don’t disavow for a moment the all-economic-weather goal of SDA+, but we also don’t ignore the potential value of weighing external expert analysis and forecasts, provided they can be integrated while preserving the systematic rules-based discipline of SDA+. To illustrate, the limited scope for professional judgment in SDA+ can be likened to a swim lane whose boundaries are clearly defined but allow room for how one navigates within them. Synthesizing macroeconomic and market forecasts are examples of the limited way we exercise professional judgment to aid us in determining the most suitable lane position – whether favoring the left, right, or middle.
Skipping to the Punchline
Kindly bear with us as we transition from the swimming pool to the golf course, drawing inspiration from golf pros who coach amateurs to keep their minds uncluttered by too many ideas and instead concentrate on a single swing thought. In this same keep-it-simple-spirit, we introduce the SDA+ swing thought for 2024.
What exactly does that mean?
In the simplest terms, it means that looming macro risks are causing us to exercise extra caution in the first half of the year. Fear of missing out is a very powerful driver in financial markets and there are indications that this, more than fundamental merit, is what’s currently supporting equity market valuations. Hanging around to gather the last crumbs of returns in the face of credible risks appears to be an unfavourable risk/reward trade-off.
How did we arrive at this thought?
Our outlook is based on three observations.
- Inverted yield curve
- Unfavourable forward-looking valuation metrics
- Extreme greed sentiment indicator
Inverted Yield Curve
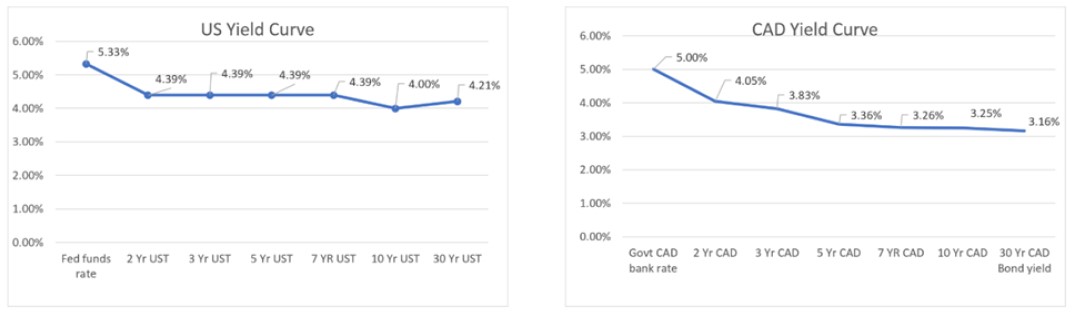
While it’s not a perfect signal, an inverted yield curve is a temporary abnormality that typically precedes an economic recession, so ignoring this possibility is imprudent. Moreover, even if the Fed has, against the odds, engineered a soft-landing there are yield curve normalization scenarios arising from it that can still be damaging for equity markets.
In fact, Morgan Stanley’s Chief Investment Officer, Mike Wilson, argues that a soft-landing scenario may be the worst case for stock and bond markets because the yield curve will normalize by steepening to a higher for longer rate regime. This will constrain corporations as they enter a multi-year debt re-financing cycle with a Fed that would be hard pressed to come to the rescue again with a COVID style intervention.
Though it’s impossible to predict exactly how the yield curve will normalize and the implications therefrom, it is probable that it will normalize one way or another in the first half of 2024. Given that even slight alterations to the slope of the curve can have significant implications for equity market valuations, we are inclined to exercise extra caution in the first half to allow for greater clarity on the yield curve normalization event risk.
Unfavourable Forward-Looking Valuation Metrics
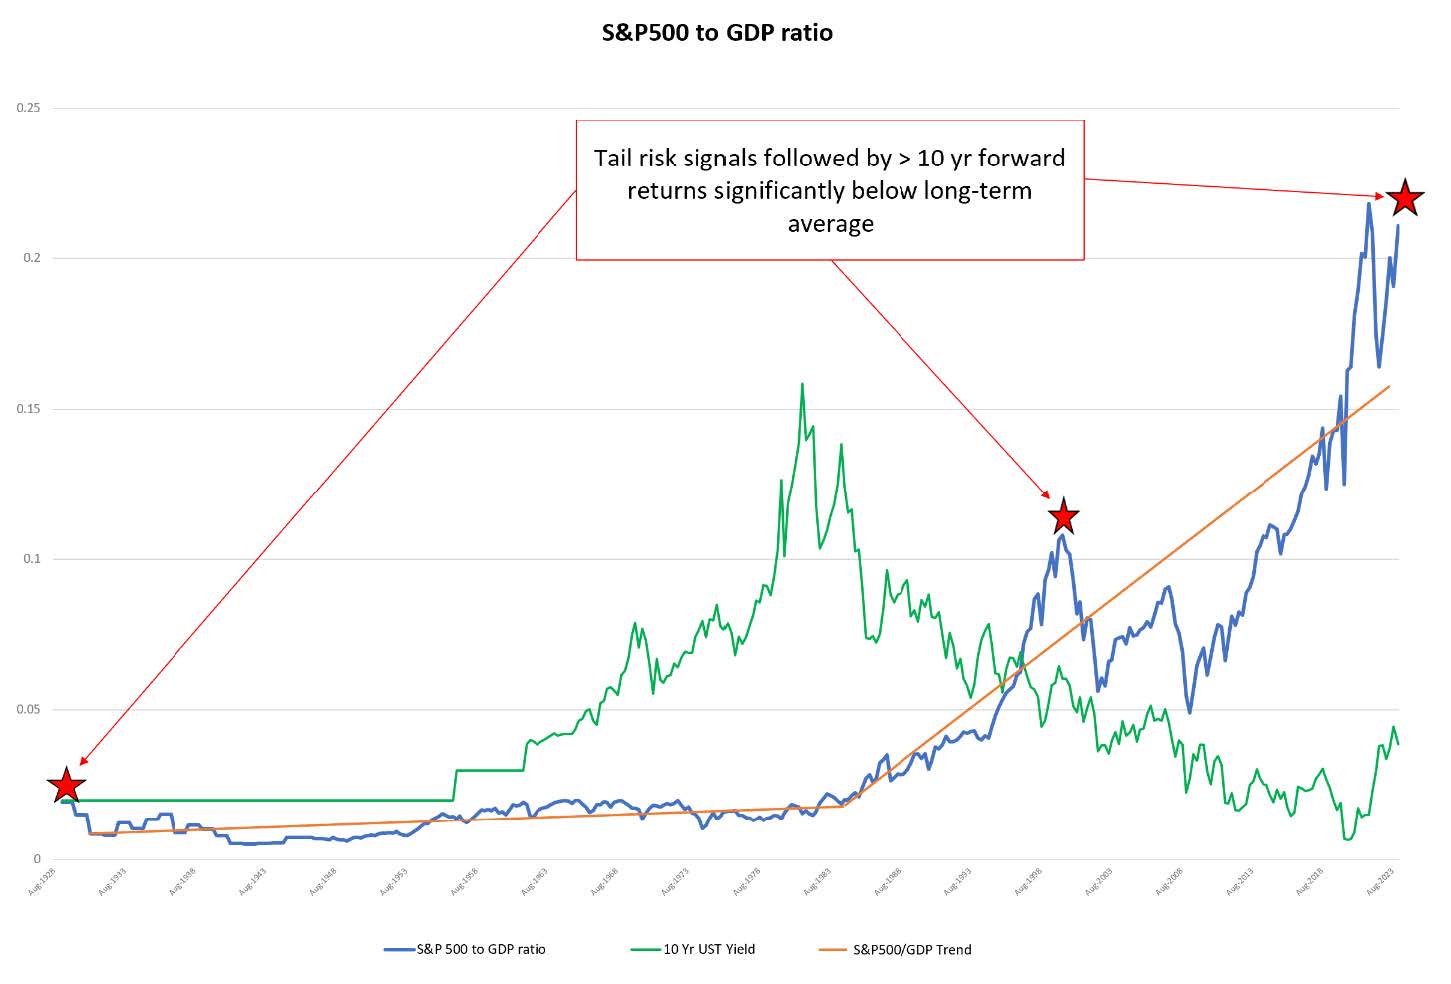
NCP tracks the S&P 500 to GDP ratio (above) to objectively monitor the relative value of the S&P 500 in relation to the underlying economy. We use this to identify periods that are statistically extreme versus the established trend. Again, no model provides an entirely reliable signal, but past extremes have preceded >=10 yr. periods with cumulative returns of 0%.
This same measure caused us to be extra cautious at the start of 2022 which helped SDA+ to avoid drawdowns in the first half of the year and enabled it to post a strong return (+10.2%) in a year where the S&P 500 TR declined -18.3%.
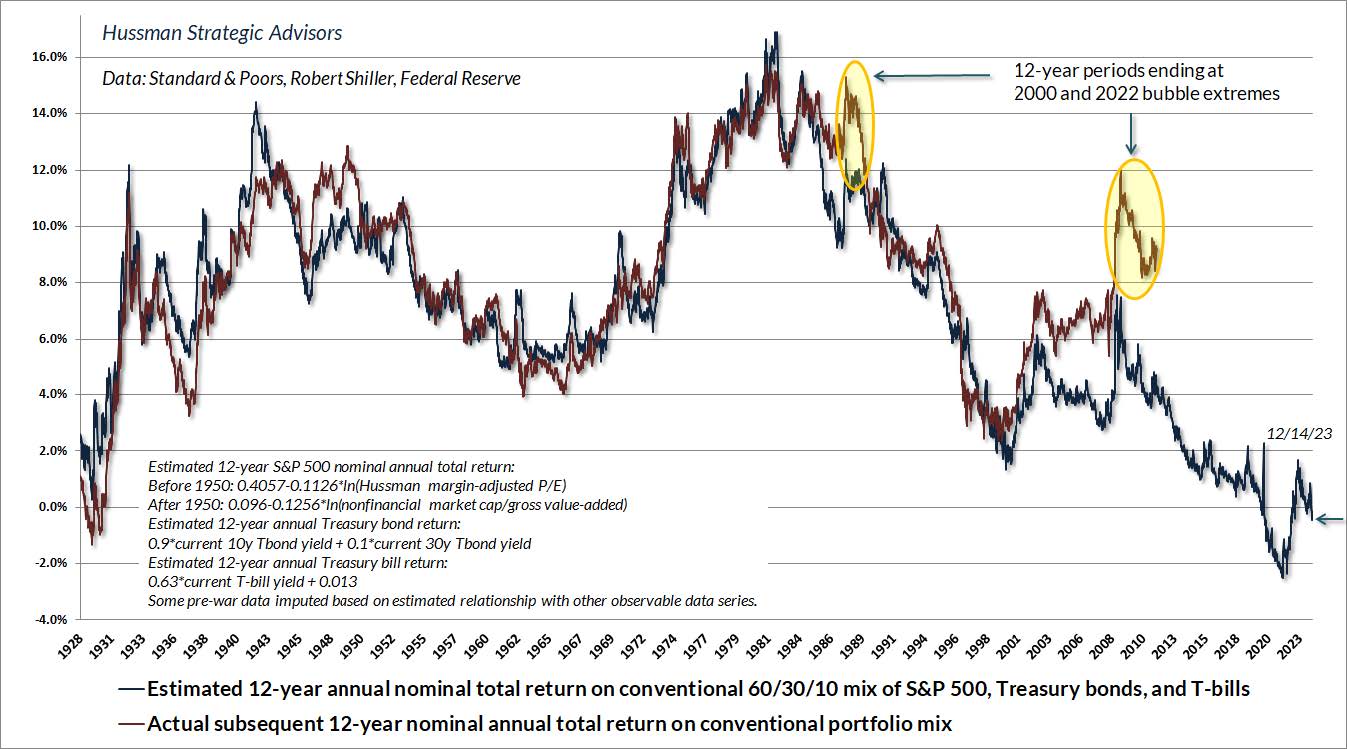
Hussman Strategic Advisors (above) use a modified Schiller model that has back tested well in forecasting the 12 yr. forward returns of a balanced portfolio. Hussman’s model also raises the cautionary flag with its forecast of a 0% 12 yr. forward return based on 2022 data which is less extreme than today.
Shorter term traditional indicators like forward PE ratios also make the case that markets may be extended and susceptible to retracement.
The S&P 500 is currently trading at more than 20 x $231 consensus forward earnings. Per Morgan Stanley’s Mike Wilson, if a more normal 16.5 earnings multiple was applied, the S&P 500 would be valued almost 20% lower just below 3,900.
We would be remis if we did not present counter arguments from the more constructive camp. Goldman Sachs softish landing call forecasts modest 5% year over year growth and puts 2024 earnings slightly ahead of consensus at $237. Like most strategists, Goldman point out that the performance of the magnificent seven (Microsoft, Amazon, Alphabet, Apple, Meta, NVIDIA, Tesla) mask the fact that the equal weight S&P 500 is not plagued by extreme valuations and in fact lags considerably. For this reason, Goldman and others argue that rotation away from the current big tech leadership names offers more reasonable value. This argument is not without merit, however it’s far from clear that such a rotation is possible in a market dominated by index funds that buy the market cap weighted index. In any event, even with it’s more constructive outlook, Goldman is not calling for significant performance upside with a 2024 year-end target of just 5,000 (+5.25%) for the S&P 500.
From a valuation perspective then, we choose to err once again on the side of caution. With the upside arguments from the constructive camp being a rather tepid +5.25% and equally credible –20% downside risk also present, caution would appear to be the better part of valor in 2024.
Extreme greed sentiment indicator
As a strategy that seeks to arbitrage short term extremes in the rate of change of equity markets, SDA+ pays close attention to sentiment indicators that invariably accompany outsized rates of change. As with all indicators there is a mix of signal and noise, but extreme sentiment readings typically do not persist and can be reasonable indicators of pending mean reversion around a trend line. So, what does 2023 year-end sentiment suggest?
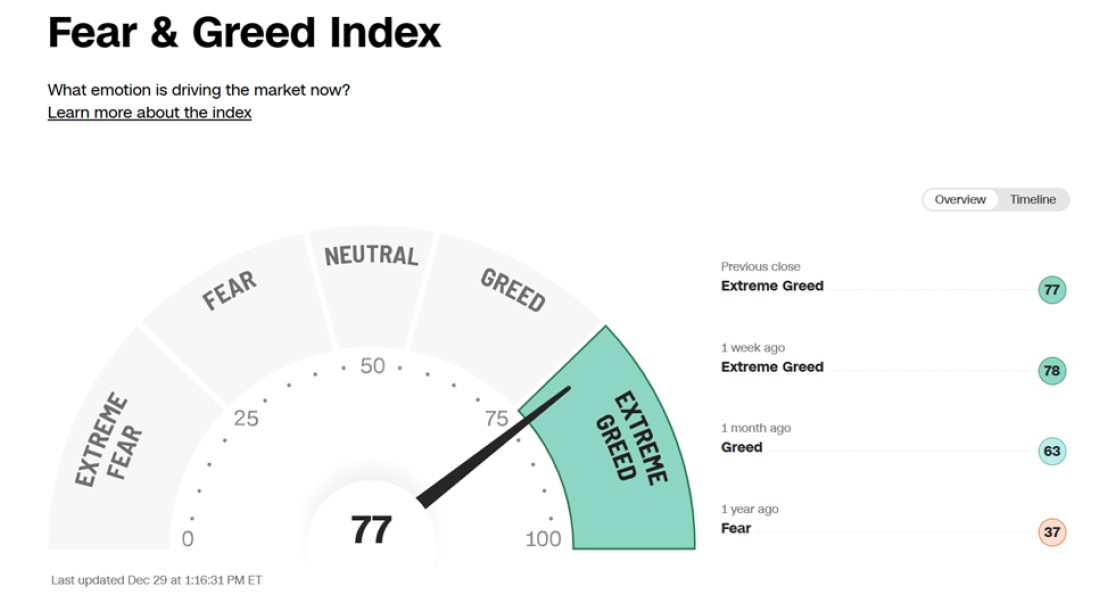
It’s unsurprising that the astonishing 2023 year-end rally coincides with sentiment finishing the year at extreme greed levels. The S&P 500’s nominal return of 14.5% from November to year-end translates to a statistically unsustainable annualized rate of change of more than 90%. From a behavioral finance perspective, it’s entirely normal that such extraordinary returns would stir the animal spirits of investors, evoking extreme greed sentiment. At such moments it’s very difficult for equity markets to be undervalued.
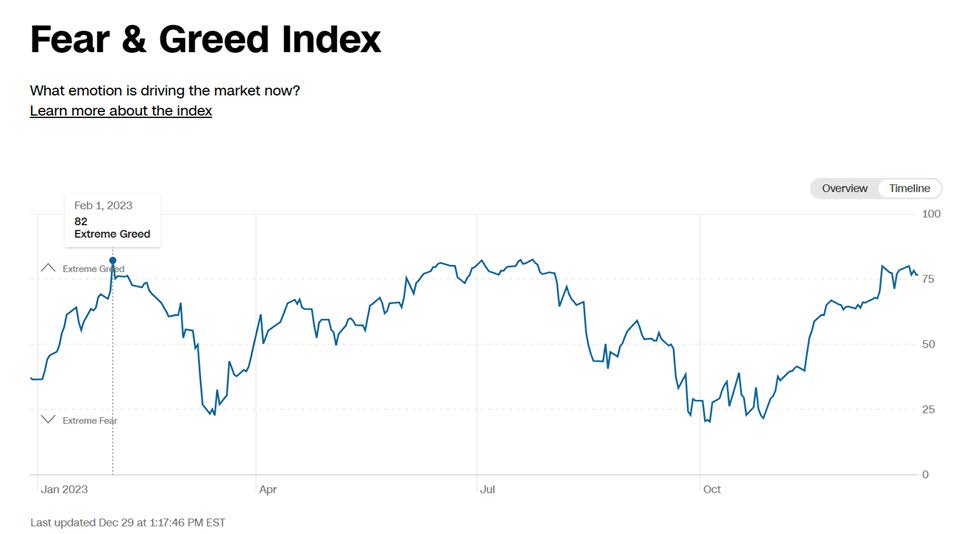

Comparing 2023 negative monthly return data (above) to the sentiment timeline view (top) the 2023 data shows that extreme greed preceded a mean reversion of sentiment and a resulting market drawdown in the months that followed. Coming into 2023 the S&P 500 was down -18.3% so the post February drawdown was more modest –2.4% than it might otherwise have been. However, the fall drawdown –8.6% following the July 2023 sentiment peak was textbook.
At the time of writing in mid-January 2024 the index is flat, greed sentiment is high, and valuations are full to rich, so the probability of a repeat of the February 2023 experience (or worse) cannot be easily dismissed. All bets are off when unpredictable exogenous shocks occur so we disregard them, but we can, and do, seek to avoid predictable events with disruptive potential. The current case in point is the January earnings calendar that peaks during the last week of January and early February. If any signs of earnings growth deceleration appear and/or guidance is lackluster, the market is certainly vulnerable.
From a sentiment perspective then, we are again taking a very defensive approach. All short put exposure expires before the underlying companies report and 95% of the contracts expire before (Jan 19 & 26th) the earnings parade kicks off. SDA+ is long just one covered position and is ideally positioned to turn opportunistic should weakness present.
Bringing it all together – practical implications
Taken together, the aforementioned risk factors persuade us to adopt our current extremely defensive posture featuring almost no long, or contingent long (via short puts), equity market exposure. The lone long position was assigned during the fall drawdown period. It now sits in a comfortable unrealized gain position, pays a healthy dividend, and has covered calls written against it that meet or exceed the annualized income target.
On a going forward basis, the practical implication for SDA+ is that when selecting put contracts we will favour greater downside risk mitigation over premium yield. We will also keep the average days to expiry (DTE) duration short to retain maximum flexibility. These modest tactical adjustments exemplify the type of swimlane professional discretion that was discussed in the introduction. Nothing changes in terms of the systematic screening process that ensure the quality of the potential underlying portfolio. Our buy discipline just becomes more stringent, requiring a higher rate of negative change and a cumulative discount to 52-week high greater than 10% before we are prepared to get assigned and take on equity risk. This necessarily sacrifices some yield, but it is a trade-off that appropriately prioritizes our number one objective to preserve capital.
As with any forecasting exercise we not only recognize its limitations, but we are also not so tied to it that we cannot adjust if as and when the facts change. SDA+ achieved robust returns of +19.1% in 2023. We are committed to maintaining our disciplined approach to target returns and safeguarding these gains. Our goal is to build upon the successes of 2023 and deliver another strong year, meeting or surpassing our 10% target in 2024 . We look forward to the inevitable twists and turns that this New Year holds, steady as she goes.
Management Team

This is not an offering of investment advice or solicitation and should not be used as a basis for making investment decisions. It is not intended for distribution to, or use by, any person or entity in any jurisdiction or country where such distribution or use would be prohibited by law or regulation or which would subject NCP to a registration requirement within such jurisdiction or country. We do not guarantee accuracy or completeness, although we attempt to update information on a timely basis. Neither NCP Capital Partners nor any of its directors, officers, employees or agents shall have any liability, howsoever arising, for any error or incompleteness of fact or opinion in it or lack of care in its preparation or publication; provided that this shall not exclude liability to the extent that this is impermissible under securities laws. All statements and opinions are liable to change without notice.